2022 has been rough all-around for the American consumer. Not only are we battling decades-high inflation, but investors’ portfolios are off to one of the worst starts to a year in history as we near the halfway point. Our technical work is first and foremost rooted in trend following, and the trend in both stock and bond prices so far this year have of course been down. However, one trend that has been strongly higher is energy prices. It may be early, but we see some potential signs that energy trends could be changing, which would not only have positive implications for consumers’ wallets, but also potentially investors’ investment portfolios.
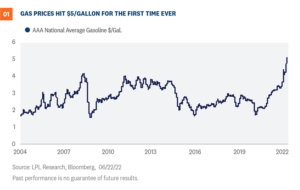
Gas prices hit record highs
Let’s start with the single price that matters to consumers most: gas prices. Even if you drive an electric car, it would be hard not to notice the huge increase in gas prices over the past year. As shown in Figure 1, the AAA national average price for a gallon of gasoline just hit $5 for the first time ever. For many Americans, the amount of gasoline they need is simply fixed, as they must drive to work, school, etc. So when prices rise, the money has to come from somewhere else, and it should therefore come as no surprise that the consumer discretionary sector is the worst performing S&P 500 Index sector year-to-date with a more than 30% loss. Don’t forget that what matters to consumers also matters to politicians. President Biden’s approval rating has continued to decline amid higher inflation numbers, with a near perfect inverse correlation to gas prices. That has implications for the midterm elections, where Republicans will look to capitalize on inflation and spin their energy policies as the solution. Currently, betting markets show about 3:1 odds that Republicans will be able to take control of both the House of Representatives and the Senate in November.
Energy policy remains a wild card
To be sure, the Biden administration, while focused squarely on its policy of transitioning the economy towards a non-fossil fuel environment, has been trying to alleviate the burden of rising gasoline and diesel prices by trying to introduce a federal gasoline tax holiday. The administration wants the federal tax holiday, which would take 18.4 cents off a gallon of gasoline, to be introduced along with a state tax holiday. A tax break from both state and federal governments is expected to give consumers approximately $30 of savings per month for one weekly fill-up. The breakdown in savings comes from the 18.4 cents per gallon for the federal tax and 31 cents per gallon on average from state governments. The tax holiday, which would last for three months, needs congressional approval, and so far, despite intense lobbying efforts, approval doesn’t appear forthcoming. In addition, the administration has become increasingly vocal in encouraging energy companies to increase drilling, while an upcoming presidential visit to Saudi Arabia is being highlighted as an opportunity to discuss measures to foster peace in the Middle East. Still, given that Saudi Arabia is the de facto leader of OPEC, the goals of the visit undoubtedly include an attempt to return with an agreement for higher oil production levels. OPEC, despite raising production levels in July and August, is seemingly intent on keeping prices high as member countries recover from the drought of demand incurred by the pandemic. Ironically, although lower gasoline prices could encourage more consumer discretionary spending, it could also lead to more travel by car, exactly the opposite of what’s needed to help bring down inflation. A long-term solution still remains unclear, as the low oil price environment that has reigned over much of the past eight years has consistently punished American oil companies for investment and rewarded more shareholder-friendly policies such as dividends and share buybacks. Still, the all-important U.S. consumer needs a break regardless of how it’s delivered.
Energy prices drive inflation expectations
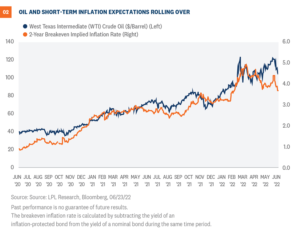
Nothing we have addressed so far is especially positive, so let’s get to that part. While the gasoline prices shown in Figure 1 are just pennies removed from those all-time highs, gas prices at the pump tend to operate on a lag from real world commodity prices. In the past few weeks, the price of West Texas Intermediate (WTI) crude oil has fallen approximately 15%, losing a technical support level we believed would hold near $115/barrel. While the trend in most energy/oil prices is still higher from a long-term perspective, numerous other commodities that have experienced strong bullish runs appear to be more clearly breaking down, so the odds of a top in oil prices may be higher than just the chart itself suggests. As global central banks fight inflationary pressures around the globe with rate hikes, the result has been a perception that the economy will not be able to withstand continued tightening of financial conditions and will fall into a marked slowdown, if not an all-out recession. For instance copper, often referred to as Dr. Copper for its ability to forecast economic conditions, just hit its lowest level since February 2021. That in and of itself isn’t a positive, but as shown in Figure 2, market-based inflation expectations are highly correlated with commodities, especially oil, and those also appear to be rolling over recently, with the two-year breakeven implied inflation rate recently hitting its lowest level in four months. To be clear, we do believe that fundamentals still matter, but it would be naïve to suggest that the Federal Reserve (Fed) and the potential path of its rate hikes have not been the primary focus of short-term market moves this year, and so far, that shows little signs of changing. Any shift towards a more dovish Fed, whether it be from economic weakness or lowered inflation expectations, is almost certain to be a positive for bonds, which have fallen dramatically amid the latest surge in inflation and skyrocketing interest rates, but may also be a positive for equities which seemed potentially already priced for a recession.
Conclusion
So far in 2022, energy investors have been some of the only equity holders rewarded, with the sector up approximately 30% year to date, and the only S&P 500 sector in positive territory. While we remain positive on that sector and do not see a dramatic reversal lower in crude prices, any easing of the constant upward pressure on energy prices like we have seen recently could still allow energy companies to thrive, while providing relief to consumers and the current inflation dynamic. Expectations are just that, expectations, but if the commodity price decline combined with easing supply chain issues can bring inflation lower over the second half of 2022, things may turn around quickly for both stocks and bonds. Scott Brown, CMT, Technical Market Strategist, LPL Financial Quincy Krosby, Chief Equity Strategist, LPL Financial ______________________________________________________________________________________________ IMPORTANT DISCLOSURES This material is for general information only and is not intended to provide specific advice or recommendations for any individual. There is no assurance that the views or strategies discussed are suitable for all investors or will yield positive outcomes. Investing involves risks including possible loss of principal. Any economic forecasts set forth may not develop as predicted and are subject to change. References to markets, asset classes, and sectors are generally regarding the corresponding market index. Indexes are unmanaged statistical composites and cannot be invested into directly. Index performance is not indicative of the performance of any investment and does not reflect fees, expenses, or sales charges. All performance referenced is historical and is no guarantee of future results. Any company names noted herein are for educational purposes only and not an indication of trading intent or a solicitation of their products or services. LPL Financial doesn’t provide research on individual equities. All information is believed to be from reliable sources; however, LPL Financial makes no representation as to its completeness or accuracy. U.S. Treasuries may be considered “safe haven” investments but do carry some degree of risk including interest rate, credit, and market risk. Bonds are subject to market and interest rate risk if sold prior to maturity. Bond values will decline as interest rates rise and bonds are subject to availability and change in price. The Standard & Poor’s 500 Index (S&P500) is a capitalization-weighted index of 500 stocks designed to measure performance of the broad domestic economy through changes in the aggregate market value of 500 stocks representing all major industries. The PE ratio (price-to-earnings ratio) is a measure of the price paid for a share relative to the annual net income or profit earned by the firm per share. It is a financial ratio used for valuation: a higher PE ratio means that investors are paying more for each unit of net income, so the stock is more expensive compared to one with lower PE ratio. Earnings per share (EPS) is the portion of a company’s profit allocated to each outstanding share of common stock. EPS serves as an indicator of a company’s profitability. Earnings per share is generally considered to be the single most important variable in determining a share’s price. It is also a major component used to calculate the price-to-earnings valuation ratio. Forward Price to Earnings is a measure of the price-to-earnings ratio (P/E) using forecasted earnings for the P/E calculation. While the earnings used are just an estimate and are not as reliable as current earnings data, there is still benefit in estimated P/E analysis. The forecasted earnings used in the formula can either be for the next 12 months or for the next full-year fiscal period. All index data from FactSet. This research material has been prepared by LPL Financial LLC. Securities and advisory services offered through LPL Financial (LPL), a registered inv estment advisor and broker -dealer (member FINRA/SIPC). Insurance products are offered through LPL or its licensed affiliates. To the extent you are receiving investment a dvice from a separately registered independent investment advisor that is not an LPL affiliate, please note LPL makes no representation with respect to such entity. Not Insured by FDIC/NCUA or Any Other Government Agency | Not Bank/Credit Union Guaranteed | Not Bank/Credit Union Deposits or Obligations | May Lose Value
RES-1197950-0622 | For Public Use | Tracking # 1-05297784 (Exp. 06/23)
Many pundits are issuing recession warnings and saying the economy is heading for a hard landing. Amid the cacophony of voices, we think the economy is slowing just like central bankers want but not shrinking. Further, we argue that a slowing economy is very different than a shrinking one.
Economy Slowing, Not Shrinking
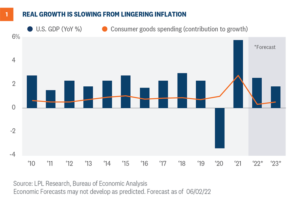
We believe the domestic economy will continue to grow this year. Other than the GDP (gross domestic product) anomaly in Q1, we think the economy has sufficient momentum to offset the inflationary pressures. “Our base case forecast is an inflation rate that moderates as supply bottlenecks improve and we get some closure to the Russian war with Ukraine,” explained LPL Financial Chief Economist Jeffrey Roach. Figure 1 shows our most likely scenario: the economy avoids a recession as forecasted growth approaches 2.6% in 2022 with another downshift to under 2% in 2023. The U.S. economy grew 5.7% in 2021 after contracting by 3.4% the previous year. Last year consumer spending was extremely robust, particularly on consumer goods as consumers were still less inclined to spend on services. Goods spending contributed roughly 2.7 percentage points to the headline growth rate, the highest since 1955. While we do not think consumer spending will continue at this clip in 2022, the consumer will likely weather the headwinds of high prices and geopolitical uncertainty and support the overall economy throughout 2022. Consumer spending will likely slow the latter half of this year as inflation pressures weigh on consumers and wage growth likely lags inflation. These factors in tandem will erode consumers’ real purchasing power. However, recent spending activity shows a fairly stable consumer. Real consumer spending rose 0.7% in April, the fourth consecutive monthly increase in real spending. The job market is tight, supporting consumer spending from gains in personal income, but the real cushion for consumers comes from roughly $3 trillion in excess savings accumulated during the pandemic.
Inventory Rebuilding Could Add to Growth
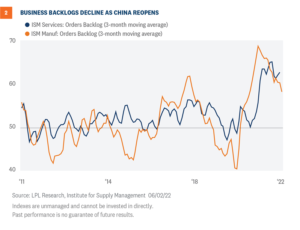
If supply bottlenecks improve, we expect to see firms restocking inventories, supporting underlying economic growth. As shown in Figure 2, the latest reports from the Institute of Supply Management show that order backlogs are declining for both the manufacturing and services sectors. As firms have improved access to required inputs and as the transportation sector recalibrates to the current environment, the economy could likely see growth in the latter half of this year and avert recession.
Inflation Is Still the Wild Card
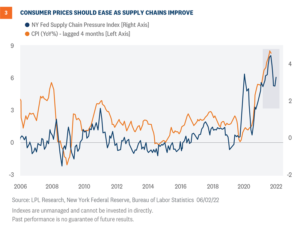
Inflation will still likely be above the Federal Reserve’s (Fed) long-run target, but inflation growth rates will likely cool throughout this year. As shown in Figure 3, improvements in supply chains impacted consumer prices. Technically, consumer price changes lagged four months and are 72% correlated with the New York Fed’s Global Supply Chain Pressure Gauge. Given the improvement in supply chains, inflation pressures should subside. And as inflation eases, the Fed will not likely need to increase rates much above neutral.
Residential Investment Will Put a Drag on Growth in the Second Half
A slowdown in residential investment will likely have a big impact on growth this year. The slowdown could come from both the demand and supply side as interest rates increase. The average rate on a 30-year fixed rate mortgage rose over 2 percentage points since the beginning of the year and has created a damper on housing activity. Secondary effects from rising mortgage rates will likely slow consumer spending. At the beginning of this year, the principal and interest payment on a $300,000 loan at 3.27% was $1,309. At the end of May, the monthly payment rose by $366. As housing becomes a larger percentage of an individual’s budget, we will likely see a decrease in discretionary spending. When we look at changes in borrowing costs we often focus on homebuyers, but higher borrowing costs also affect builders. High capital and labor costs are a current challenge for all builders, and high interest rates particularly impact developers who rely on the debt market for construction. Tighter financial conditions could eventually slow new home construction, putting a damper on home supply and residential investment. Inventories of new and existing homes are already low, and if builders slow the rate of construction, home prices will not likely decline as much as they did in 2006 – 2011 since current supply is low.
Risks to the Outlook
A still unknown variable to our forecasts is the Federal Reserve’s shrinkage of its balance sheet, known as quantitative tightening (QT). The Fed will only allow its balance sheet to shrink incrementally over time while also paying attention to the impact QT is having on the markets. The Fed has stated that QT could “replace” several rate hikes as a way to tighten financial conditions; therefore, we could conceivably see a lower fed funds terminal rate than what is already priced in the markets, which should help the Fed navigate a “softish” landing of the economy slowing but not shrinking. Jeffrey Roach, PhD, Chief Economist, LPL Financial Lawrence Gillum, CFA, Fixed Income Strategist, LPL Financial ______________________________________________________________________________________________ IMPORTANT DISCLOSURES This material is for general information only and is not intended to provide specific advice or recommendations for any individual. There is no assurance that the views or strategies discussed are suitable for all investors or will yield positive outcomes. Investing involves risks including possible loss of principal. Any economic forecasts set forth may not develop as predicted and are subject to change. References to markets, asset classes, and sectors are generally regarding the corresponding market index. Indexes are unmanaged statistical composites and cannot be invested into directly. Index performance is not indicative of the performance of any investment and does not reflect fees, expenses, or sales charges. All performance referenced is historical and is no guarantee of future results. Any company names noted herein are for educational purposes only and not an indication of trading intent or a solicitation of their products or services. LPL Financial doesn’t provide research on individual equities. All information is believed to be from reliable sources; however, LPL Financial makes no representation as to its completeness or accuracy. U.S. Treasuries may be considered “safe haven” investments but do carry some degree of risk including interest rate, credit, and market risk. Bonds are subject to market and interest rate risk if sold prior to maturity. Bond values will decline as interest rates rise and bonds are subject to availability and change in price. The Standard & Poor’s 500 Index (S&P500) is a capitalization-weighted index of 500 stocks designed to measure performance of the broad domestic economy through changes in the aggregate market value of 500 stocks representing all major industries. The PE ratio (price-to-earnings ratio) is a measure of the price paid for a share relative to the annual net income or profit earned by the firm per share. It is a financial ratio used for valuation: a higher PE ratio means that investors are paying more for each unit of net income, so the stock is more expensive compared to one with lower PE ratio. Earnings per share (EPS) is the portion of a company’s profit allocated to each outstanding share of common stock. EPS serves as an indicator of a company’s profitability. Earnings per share is generally considered to be the single most important variable in determining a share’s price. It is also a major component used to calculate the price-to-earnings valuation ratio. All index data from FactSet. This research material has been prepared by LPL Financial LLC. Securities and advisory services offered through LPL Financial (LPL), a registered inv estment advisor and broker -dealer (member FINRA/SIPC). Insurance products are offered through LPL or its licensed affiliates. To the extent you are receiving investment a dvice from a separately registered independent investment advisor that is not an LPL affiliate, please note LPL makes no representation with respect to such entity. Not Insured by FDIC/NCUA or Any Other Government Agency | Not Bank/Credit Union Guaranteed | Not Bank/Credit Union Deposits or Obligations | May Lose Value
RES-1179500-0522 | For Public Use | Tracking # 1-05290182 (Exp. 06/23)
First quarter earnings season was solid by just about any measure, but based on recent market behavior it’s obvious that in general market participants paid little attention. This is a macro-driven market, so it will likely take positive macro developments, i.e., better news on the inflation front, to turn stocks around. However, these results are impressive on their own and shouldn’t hurt the case for the bulls. The question is when will the micro stop getting drowned out by the macro.
By the Numbers
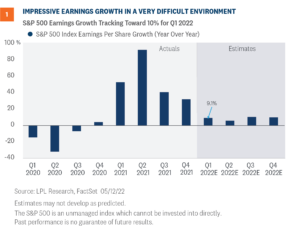
In our earnings season preview, we expected a high single-digit increase in S&P 500 Index earnings for the quarter, and that is what we got. The consensus estimate coming into reporting season was calling for a 4.7% earnings gain, and now it looks like 10% is possible with more than 40 index constituents still left to report results [Figure 1]. This is an impressive result given the challenges currently facing companies—intense cost pressures, COVID-19, and Russia’s Ukraine invasion with resulting sanctions. The revenue growth corporate America was able to generate—over 13% year over year—was perhaps even more impressive. An upside surprise of about 2.7 percentage points doesn’t sound like a lot, but for revenue it is. Revenue is easier to predict, and companies can’t cost cut their way to more sales. The five-year average is 1.7 points of revenue upside, and the pre-pandemic average was 0.8. Here are some more numbers to put these impressive results in perspective:
A very strong 78% of S&P 500 companies beat earnings estimates for the quarter, slightly above the long-term average of 77%.
Excluding financials, S&P 500 earnings per share are on track to grow about 14%.
Excluding energy, S&P 500 earnings per share are on track to grow only about 4%.
The biggest upside earnings surprises came from utilities, while consumer staples, financials, healthcare, and materials also generated strong upside surprises.
Consumer discretionary was the only sector to miss analysts’ earnings target, falling a massive 35% short due to Amazon. The LPL Research Strategic and Tactical Asset Allocation Committee (STAAC) remains underweight to the consumer discretionary sector.
A solid 74% of S&P 500 companies have beaten revenue forecasts, above the five-year average of 69%.
About half of the revenue growth for the quarter came from the energy and healthcare sectors.
The biggest upside revenue surprises came from energy and utilities, while only communication services missed analysts’ revenue target.
Biggest Challenge: Profit Margins
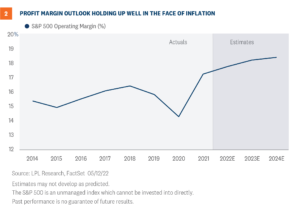
In our earnings season preview on April 18, we highlighted three things to watch: margin pressures, pricing power, and supply chain status. Clearly two of those three things relate to profit margins, though we would argue all three do. In this inflationary environment, the revenue is coming through. But it is profit margins that were the biggest test for corporate America this quarter, and companies passed that test with flying colors. Not only did margins hold up well quarter over quarter—falling less than anticipated—but analysts’ estimates for margins going forward still show margin expansion from current levels [Figure 2]. We know analysts’ estimates tend to be overly optimistic, but we still view the trajectory of these forecasts as a positive sign for future profitability. However, these margin forecasts will be tough to reach in the coming year if high inflation lingers. Although signs of a peak in inflation have emerged, the pace of improvement may be stubbornly slow. It’s difficult to envision the labor market getting significantly better in a short period of time, but labor market participation is key to alleviating wage pressures and wages are the biggest component of companies’ cost structures. And company guidance suggests supply chain disruptions may linger well into the fall, longer than we previously anticipated.
Estimates Keep Going Higher
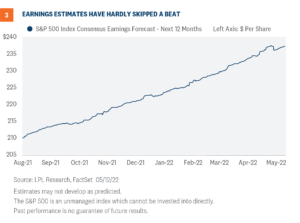
Inflation is not a new challenge for companies. The Consumer Price Index has increased more than 6% year over year for seven months now. Last fall, before Russia’s Ukraine invasion, in Outlook 2022: Passing the Baton, we wrote the following: With stable profit margins and increasing share buybacks likely next year, a double-digit percentage increase in S&P 500 earnings per share (EPS) is a possibility. But COVID-19-related supply chain issues and materials and labor shortages are risks that could lead to higher costs in 2022, weighing on profit margins. That led us to our conservative forecast for S&P 500 EPS in 2022 of $220, only 6% above the now-final EPS number for 2021. But instead of seeing estimates come down because of these cost pressures, they have continued to move higher. The consensus estimate for S&P 500 EPS in 2022 has increased 2.6% this year to $229.22 per share, which is remarkable considering how difficult the operating environment has become [Figure 3]. How have they done it? Primarily through pricing power that has boosted revenue. The consensus estimate for revenue this year has increased 4.2% year to date. It hasn’t been difficult to sell customers on the idea of paying higher prices in this environment when higher costs are affecting everyone. The good news is higher wages and pandemic savings have helped consumers afford those prices. Companies have also managed higher costs efficiently, in many cases doing more with less. That narrative certainly fits the energy sector which is also enjoying a revenue windfall. Energy sector employment has fallen significantly over the past couple of years, according to Bureau of Labor Statistics data. National employment is still below pre-pandemic levels, yet trailing 12 month S&P 500 revenue is up 12%. Bottom line, we recognize our $220 per share forecast for 2022 S&P 500 earnings is probably too low and that number probably comes in closer to $225, up 8% year over year.
Can Earnings Help This Market Turn Around?
Earnings will be part of the stock market rebound we expect over the rest of the year. We expect S&P 500 earnings to grow high single digits this year despite the aforementioned challenges. Those gains, coupled with much more reasonable valuations following the selloff, may help push stocks higher in the coming months. However, inflation is the most important piece of the story. Until markets get confidence that inflation will move steadily lower over time and become comfortable with the role the Federal Reserve will play to get us there, P/E multiple expansion will be tough to come by and stocks may remain in correction territory. On the other side, keep in mind just two additional points on the P/E—from 16.5 to 18.5—would push the S&P 500 12% higher. We continue to prefer a modest overweight allocation to equities and a slight underweight to fixed income relative to investors’ targets, as appropriate. Our year-end 2022 fair value target for the S&P 500 is 4,800–4,900, 19% above the May 13 closing price at the low end. We are actively considering adding to our equities allocation. Jeff Buchbinder, CFA, Equity Strategist, LPL Financial Ryan Detrick, CMT, Chief Market Strategist, LPL Financial ______________________________________________________________________________________________ IMPORTANT DISCLOSURES This material is for general information only and is not intended to provide specific advice or recommendations for any individual. There is no assurance that the views or strategies discussed are suitable for all investors or will yield positive outcomes. Investing involves risks including possible loss of principal. Any economic forecasts set forth may not develop as predicted and are subject to change. References to markets, asset classes, and sectors are generally regarding the corresponding market index. Indexes are unmanaged statistical composites and cannot be invested into directly. Index performance is not indicative of the performance of any investment and does not reflect fees, expenses, or sales charges. All performance referenced is historical and is no guarantee of future results. Any company names noted herein are for educational purposes only and not an indication of trading intent or a solicitation of their products or services. LPL Financial doesn’t provide research on individual equities. All information is believed to be from reliable sources; however, LPL Financial makes no representation as to its completeness or accuracy. The Standard & Poor’s 500 Index (S&P500) is a capitalization-weighted index of 500 stocks designed to measure performance of the broad domestic economy through changes in the aggregate market value of 500 stocks representing all major industries. The Consumer Price Index (CPI) is a measure of the average change over time in the prices paid by urban consumers for a market basket of consumer goods and services. The PE ratio (price-to-earnings ratio) is a measure of the price paid for a share relative to the annual net income or profit earned by the firm per share. It is a financial ratio used for valuation: a higher PE ratio means that investors are paying more for each unit of net income, so the stock is more expensive compared to one with lower PE ratio. Earnings per share (EPS) is the portion of a company’s profit allocated to each outstanding share of common stock. EPS serves as an indicator of a company’s profitability. Earnings per share is generally considered to be the single most important variable in determining a share’s price. It is also a major component used to calculate the price-to-earnings valuation ratio. All index data from FactSet. This research material has been prepared by LPL Financial LLC. Securities and advisory services offered through LPL Financial (LPL), a registered investment advisor and broker-dealer (member FINRA/SIPC). Insurance products are offered through LPL or its licensed affiliates. To the extent you are receiving investment advice from a separately registered independent investment advisor that is not an LPL affiliate, please note LPL makes no representation with respect to such entity. Not Insured by FDIC/NCUA or Any Other Government Agency | Not Bank/Credit Union Guaranteed | Not Bank/Credit Union Deposits or Obligations | May Lose Value
RES-1157400-0522 | For Public Use | Tracking # 1-05281392 (Exp. 5/23)
The bear market that started on June 13 has left the S&P 500 Index 23.5% below its January 3 high. After the initial positive reaction to the Federal Reserve’s first 0.75% rate hike since 1994 and tough talk on inflation, heightened fears of recession and that the Fed might “break something” sent stocks down for the 10th week out of 11 for only the second time in history (The first was in 1970). To help investors manage through this difficult period, we answer some of the top questions we’re getting about bear markets and list some things to watch to assess progress toward an eventual durable low.
How long do bear markets typically last?
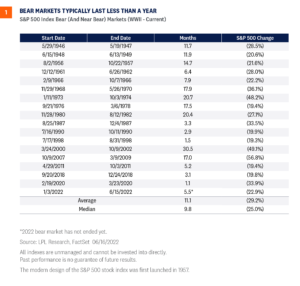
The current bear market, which began at the January 2022 highs for the S&P 500 Index, is actually already old by recent standards. At about five-and-a-half months old, it is already older than six other bear markets going back nearly 40 years, with only the 2000-2002 tech bubble and 2008-2009 financial crisis bears lasting longer. This means the bear market may be closer to a bottom than many expect. The average bear market since 1950 has taken about 11 months to mark its low, but six out of the last eight bear markets ended within six months [Figure 1]. How this bear market will end will likely hinge on the pace at which inflation comes down, which will dictate the timing and magnitude of the Federal Reserve’s (Fed) rate hiking campaign. How fast the Fed moves will determine how much the economy slows and whether something breaks (like a large financial institution going under, though that’s not our expectation). If a full-blown crisis and recession such as in 2000-2002 and 2008-09 can be avoided, this bear market may bottom soon.
How much further might stocks fall?
The average bear market since 1950 has seen the S&P 500 lose an average of about 29% (including the near bear markets that saw declines of 19-20%), as shown in Figure 1. That suggests that if this bear market ends up around the average, that stocks may drop another 5% or so. Based on current economic conditions, one could make the case that this bear market could be shallower than typical bears because consumer balance sheets and the job market are still in good shape, and interest rates are still low by historical standards. At the same time, however, the inflation problem won’t be solved quickly, suggesting we could see a slow bleed and end up down near the average of 30%. Looking back at bear markets throughout history, a key determining factor of where the declines ended has been whether the U.S. economy goes into recession. With a recession, bear market declines have averaged 35%. Without, they’ve averaged 24%, close to where the S&P 500 is now. LPL Research puts roughly 50% odds of recession in the next 12 to 18 months, and sees a mild recession if we get one, while the market has already priced in about a 70% chance of recession. As a result, the LPL Research Strategic and Tactical Asset Allocation Committee remains comfortable with 62% equities for the typical 60/40 portfolio and is considering adding to equities on weakness.
How does the bull market that just ended compare to history?
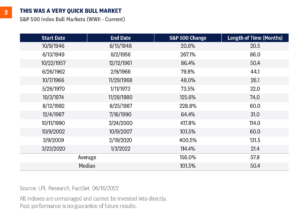
This bull market that just ended last week was short but powerful. It lasted only 21 months from the March 2020 lows through the January 2022 peak, checking in as the shortest bull market since WWII [Figure 2]. However, this bull was also the quickest to ever double, achieving that feat in just five months on August 16, 2020. While the losses experienced this year are painful, some perspective on where we came from may be helpful. Off the pandemic lows in March 2020, the S&P 500 rose 114% in less than two years before pulling back 23-24%. The index is still up 64% off its pandemic lows after this year’s decline, with a total return of 70% including dividends.
How have stocks historically done after entering bear markets?
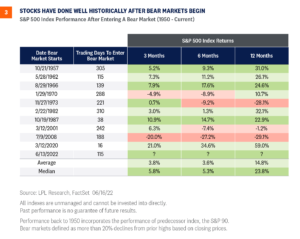
After the S&P 500 has entered a bear market, stocks have historically done pretty well, up an average of nearly 15% a year later with an even better median gain of 23.8% [Figure 3]. Those gains would be much better if not for the 1973-74 recession, the dotcom bust in 2000, and the 2008-09 financial crisis. An economy like any of these over the next year is very unlikely in our view, so we believe the likelihood that stocks are much higher a year from now is high. That doesn’t mean stocks can’t go down further in the short term, and forming a bottom could easily take a good chunk of the summer (any longer than that would surprise us). But for long-term investors, especially those who have invested relatively conservatively, it means an attractive opportunity may be developing.
How long does it typically take to recover bear market losses?
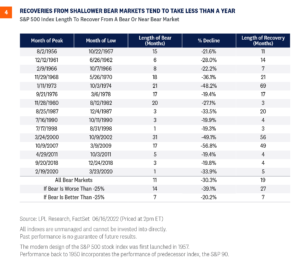
Stocks have staged some quick recoveries from bear market lows in the past. The average bear market takes about 19 months to get back all of its losses, but shallower bears—those when the S&P 500 falls less than 25%— bounce back faster. As shown in Figure 4, recoveries from bear markets that are down less than 25% take an average of just seven months to recover, while those down more than 25% (for an average decline of 39.1%) take 27 months, or over two years on average, to get back to the prior highs. Lastly, stocks have recently recovered much more quickly, at only four and five months to recover losses from the last three bear markets. We think this bear market has more in common with the less severe bear markets and therefore believe it’s reasonable to suggest this bear market may be erased in less than a year.
Are valuations low enough to help stocks find a floor?
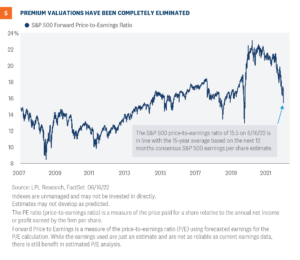
The simple answer here is it depends. With the S&P 500 at a price-to-earnings ratio (P/E) of 15.5 based on the consensus S&P 500 earnings per share (EPS) estimate for the next 12 months, valuations for U.S. large cap stocks are only slightly below the 30-year average [Figure 5]. Reasonable beats expensive, but historically bear market lows have been accompanied by P/Es below 15. However, if we move down the market cap spectrum, we find the S&P 600 Index of small cap stocks trading at 11 times next 12 months EPS, well below its long-term average of 16.5. International markets, which have suffered almost as much as U.S. stocks, enjoy attractive valuations at P/Es of 11-12 for developed and emerging markets, based on the MSCI indexes. Looking at valuations another way, relative to Treasury yields, stocks are more attractively valued than historical averages. The equity risk premium (ERP, or the earnings yield minus the 10-year Treasury yield) is 2.5%, above the long-term average below one percent (earnings yield is simply the earnings-to-price ratio). A higher ERP means stock valuations are attractive relative to bonds despite higher interest rates.
What signals are you watching to suggest lows are in?
Stocks have been unable to stage even the most modest of bear market rallies in recent months, despite extreme oversold conditions. We believe that technical damage of this magnitude is likely to take time to repair and that the chances of “V-shaped recovery” so common in the era of quantitative easing are much less likely than in recent history. Some of the quantitative metrics we are using to help assess the bottoming process include more extreme levels of the VIX (implied volatility index) followed by falling volatility as stocks decline, hedging activity in the options markets, percentages of advancing trading volume versus declining, and extreme breadth of stocks trading below long-term moving averages.
Conclusion
We don’t know where this bear market will end, but we believe we’re getting close. Consumers and businesses faced more severe challenges in some of the worst bear markets of the modern era such as 2000-2002 and 2008-2009, so we would be very surprised if this bear market came anywhere near the magnitudes of those declines. At the same time, we have not seen the indiscriminate selling that we’ve seen at other major lows to call a bottom right here. While the Fed made transitory a bad word for the markets, we remain confident that inflation will soon start to improve and continue to get better through year-end and 2023. Once the markets are convinced of that, stocks could turn around. While a positive year for stocks is a lot to ask at this point, we believe the amount of pessimism reflected in stock prices today is highly likely to diminish over the back half of the year, and that is a formula for a potential nice comeback. Jeffrey Buchbinder, CFA, Equity Strategist, LPL Financial Ryan Detrick, CMT, Chief Market Strategist, LPL Financial ______________________________________________________________________________________________ IMPORTANT DISCLOSURES This material is for general information only and is not intended to provide specific advice or recommendations for any individual. There is no assurance that the views or strategies discussed are suitable for all investors or will yield positive outcomes. Investing involves risks including possible loss of principal. Any economic forecasts set forth may not develop as predicted and are subject to change. References to markets, asset classes, and sectors are generally regarding the corresponding market index. Indexes are unmanaged statistical composites and cannot be invested into directly. Index performance is not indicative of the performance of any investment and does not reflect fees, expenses, or sales charges. All performance referenced is historical and is no guarantee of future results. Any company names noted herein are for educational purposes only and not an indication of trading intent or a solicitation of their products or services. LPL Financial doesn’t provide research on individual equities. All information is believed to be from reliable sources; however, LPL Financial makes no representation as to its completeness or accuracy. U.S. Treasuries may be considered “safe haven” investments but do carry some degree of risk including interest rate, credit, and market risk. Bonds are subject to market and interest rate risk if sold prior to maturity. Bond values will decline as interest rates rise and bonds are subject to availability and change in price. The Standard & Poor’s 500 Index (S&P500) is a capitalization-weighted index of 500 stocks designed to measure performance of the broad domestic economy through changes in the aggregate market value of 500 stocks representing all major industries. The PE ratio (price-to-earnings ratio) is a measure of the price paid for a share relative to the annual net income or profit earned by the firm per share. It is a financial ratio used for valuation: a higher PE ratio means that investors are paying more for each unit of net income, so the stock is more expensive compared to one with lower PE ratio. Earnings per share (EPS) is the portion of a company’s profit allocated to each outstanding share of common stock. EPS serves as an indicator of a company’s profitability. Earnings per share is generally considered to be the single most important variable in determining a share’s price. It is also a major component used to calculate the price-to-earnings valuation ratio. Forward Price to Earnings is a measure of the price-to-earnings ratio (P/E) using forecasted earnings for the P/E calculation. While the earnings used are just an estimate and are not as reliable as current earnings data, there is still benefit in estimated P/E analysis. The forecasted earnings used in the formula can either be for the next 12 months or for the next full-year fiscal period. All index data from FactSet. This research material has been prepared by LPL Financial LLC. Securities and advisory services offered through LPL Financial (LPL), a registered inv estment advisor and broker -dealer (member FINRA/SIPC). Insurance products are offered through LPL or its licensed affiliates. To the extent you are receiving investment a dvice from a separately registered independent investment advisor that is not an LPL affiliate, please note LPL makes no representation with respect to such entity. Not Insured by FDIC/NCUA or Any Other Government Agency | Not Bank/Credit Union Guaranteed | Not Bank/Credit Union Deposits or Obligations | May Lose Value
RES-1190200-0622 | For Public Use | Tracking # 1-05295559 (Exp. 06/23)
At the risk of sounding cliché, making the case for stocks to stage a second half rally back to the prior highs requires investors to see through some heavy cloud cover. If you prefer another market cliché, it’s times like these when investors need a crystal ball. We fully acknowledge how tough it is to see the bull case for stocks right now, and a retest of recent lows is certainly possible, but this week we lay out the bull case for the second half of the year. It starts with inflation.
The Wall of Worry is Tall
Needless to say, it’s been a tough year. The S&P 500 Index started 2022 with its worst first 100 days since 1970. There is no shortage of bearish headlines. Some of the smartest investors out there are urging caution and calling for recession (though Warren Buffett has been buying). The anxiety among investors is understandable given stock market losses, sky-high inflation, and rising recession risk. Consumer buying power is being eroded by sharply higher prices. The stimulus cavalry is not coming to the rescue. Wages are rising, and while good for consumer buying power, that worries the Federal Reserve (Fed). Materials and transportation costs are rising rapidly as supply chains remain snarled and China’s lockdowns are ongoing. It’s tough out there. Adding to the angst, the Fed’s track record of fighting inflation without causing a recession is not good. More often than not, its rate hiking campaigns have preceded (or caused) recessions—though typically at higher interest rates than we are seeing today. Nonetheless, high inflation has been a common ingredient in recessions since WWII—see the 1970s, early 1980s, early 1990s, and even 2008. Simply put, the Fed is fighting an uphill battle. So how can we still like stocks here? We’ll give you three key reasons.
Bull Case #1: Inflation Pressures will LIKELY Ease
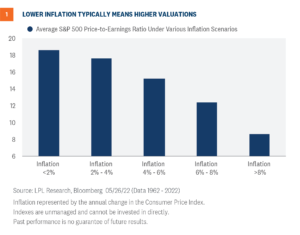
The amount of time it takes for stocks to return to prior highs will be determined by the path of inflation. LPL Research expects perhaps 1.5 percentage points to come off core consumer prices by year-end—the latest reading for the Fed’s preferred inflation measure, the Core Personal Consumption Expenditures (PCE) Index, excluding food and energy, was 4.9%. It’s fair to say a lot has to go right for that to happen, including easing supply chain disruptions, more workers entering the labor force, and a cease-fire in Ukraine. But our view is progress on these fronts over the next seven months is more likely than not. As shown in Figure 1, lower inflation tends to bring higher valuations.
Bull Case #2: Corporate America Enjoying Solid Earnings Momentum
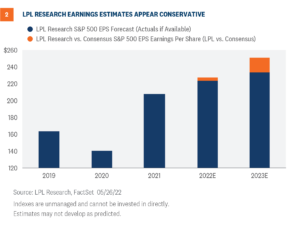
We just got through first quarter earnings season and while it wasn’t pretty, the S&P 500 earnings growth rate (9.3%), the percentage of companies beating earnings estimates (78%), and the change in the consensus next 12 months estimate for the S&P 500 during reporting season (+0.5%) were all excellent. Revenue growth exceeded 13% on a year-over-year basis, as companies were able to generally pass through price increases, limiting pressure on profit margins. There were some high profile misses, particularly among retailers, and energy certainly helped prop up the numbers (about 6 points of impact on overall S&P 500 earnings), but given the challenges of cost pressures, labor and materials shortages, and supply chain disruptions, companies did an excellent job managing through a challenging environment. Solid first quarter results set corporate America up to potentially exceed our $220 per share earnings estimate for the S&P 500 in 2022, so we are officially raising our forecast to $225. As Figure 2 illustrates, our forecast is still about $5 below the consensus estimate. Our $235 per share forecast for 2023, which is probably too low, is now more than $16 below the consensus estimate. We expect mid-to-high single-digit earnings growth in coming quarters to help support a stock market turnaround beginning this summer.
Bull Case #3: Valuations are too Low
Lower inflation supports higher valuations, as illustrated in Figure 1. The same can be said for interest rates, as lower rates increase the value of future profits and make stocks more attractive relative to bonds. So if inflation comes down in the coming months as we expect, interest rates are likely to stay in this range (our year-end forecast for the 10-year U.S. Treasury yield is 2.25—2.5%). We also believe that stocks, at recent lows, were pricing in perhaps as much as a 50% chance of recession over the next year based on the magnitude of the stock market’s decline. We see the odds of a recession in the United States during this time frame as lower than that (perhaps one in three, if not lower). We expect valuations to recapture some of the lost ground by year-end as markets come around to our view that this is a growth scare and recession is not imminent. That process to get there may not be smooth for markets, especially over the next month or so, but we think it happens over the balance of the year. In the absence of recession, earnings growth plus valuation expansion can be a powerful combination. Figure 3 shows that stocks don’t have to get back to prior peak valuations, nor do earnings have to reach next year’s consensus levels for the index to get back into the green by year-end. Our 4,800 target on the S&P 500 could potentially be reached with a 20 P/E and $240 in EPS in 2023 ($11 below consensus), or 19 times the consensus number around $251, though we acknowledge that earnings number is probably too high. Keep in mind the index entered this year at over 21 times 2022 earnings estimates. The latest rebound off the lows has lifted the next 12 months P/E to over 17.
Conclusion
We continue to prefer a modest overweight allocation to equities and a slight underweight to fixed income relative to investors’ targets, as appropriate. Our year-end 2022 fair value target for the S&P 500 is 4,800–4,900, 15% above the May 27 closing price at the low end. Our continued optimism is based largely on our expectation of continued economic and earnings growth, i.e., no recession, and lower inflation over the balance of 2022. We are considering adding to our equities allocation but are waiting for either more evidence that inflation is coming down or for technical analysis signals that have often accompanied major market lows. We would not be surprised by a retest of recent lows in the short term, but for suitable long-term investors, this could be a good entry point. Those more defensively positioned may want to consider nibbling here. Those with higher risk tolerances may consider adding at the next dip. Jeff Buchbinder, CFA, Equity Strategist, LPL Financial Ryan Detrick, CMT, Chief Market Strategist, LPL Financial ______________________________________________________________________________________________ IMPORTANT DISCLOSURES This material is for general information only and is not intended to provide specific advice or recommendations for any individual. There is no assurance that the views or strategies discussed are suitable for all investors or will yield positive outcomes. Investing involves risks including possible loss of principal. Any economic forecasts set forth may not develop as predicted and are subject to change. References to markets, asset classes, and sectors are generally regarding the corresponding market index. Indexes are unmanaged statistical composites and cannot be invested into directly. Index performance is not indicative of the performance of any investment and does not reflect fees, expenses, or sales charges. All performance referenced is historical and is no guarantee of future results. Any company names noted herein are for educational purposes only and not an indication of trading intent or a solicitation of their products or services. LPL Financial doesn’t provide research on individual equities. All information is believed to be from reliable sources; however, LPL Financial makes no representation as to its completeness or accuracy. U.S. Treasuries may be considered “safe haven” investments but do carry some degree of risk including interest rate, credit, and market risk. Bonds are subject to market and interest rate risk if sold prior to maturity. Bond values will decline as interest rates rise and bonds are subject to availability and change in price. The Standard & Poor’s 500 Index (S&P500) is a capitalization-weighted index of 500 stocks designed to measure performance of the broad domestic economy through changes in the aggregate market value of 500 stocks representing all major industries. The PE ratio (price-to-earnings ratio) is a measure of the price paid for a share relative to the annual net income or profit earned by the firm per share. It is a financial ratio used for valuation: a higher PE ratio means that investors are paying more for each unit of net income, so the stock is more expensive compared to one with lower PE ratio. Earnings per share (EPS) is the portion of a company’s profit allocated to each outstanding share of common stock. EPS serves as an indicator of a company’s profitability. Earnings per share is generally considered to be the single most important variable in determining a share’s price. It is also a major component used to calculate the price-to-earnings valuation ratio. The PCE Price Index Excluding Food and Energy, also known as the core PCE price index, is released monthly. The core index makes it easier to see the underlying inflation trend by excluding two categories – food and energy. – where prices tend to swing up and down more dramatically and more often than other prices. The Consumer Price Index (CPI) is a measure of the average change over time in the prices paid by urban consumers for a market basket of consumer goods and services. All index data from FactSet. This research material has been prepared by LPL Financial LLC. Securities and advisory services offered through LPL Financial (LPL), a registered inv estment advisor and broker -dealer (member FINRA/SIPC). Insurance products are offered through LPL or its licensed affiliates. To the extent you are receiving investment a dvice from a separately registered independent investment advisor that is not an LPL affiliate, please note LPL makes no representation with respect to such entity. Not Insured by FDIC/NCUA or Any Other Government Agency | Not Bank/Credit Union Guaranteed | Not Bank/Credit Union Deposits or Obligations | May Lose Value
RES-1172300-0522 | For Public Use | Tracking # 1-05288087 (Exp. 05/23)
Stocks have been unable to make up much ground since the June 16 lows, with a bear market rally amounting to only around a 4.3% gain in the S&P 500 Index since then (as of July 1). After the more than 6% rally the week of June 24 and the increasing optimism that came with that bounce, stocks pulled back again last week—the 11th down week for the index in the past 13 weeks. While we acknowledge that a V-shaped recovery is probably not in the cards and prior valuation targets no longer appear achievable, we remain constructive on equities for the second half, but not complacent.
Not out of the woods but some encouraging signs
Clearly markets do not yet believe we’re out of the woods as debates about whether inflation has peaked continue while the Federal Reserve (Fed) stands ready to aggressively hike its target interest rate over the next few months (at least) while shrinking its bloated balance sheet.
But there have been some encouraging signs lately:
Oil prices are down over 10% since June 8, which will likely translate into lower prices at the pump in the near term.
The inflation rate implied by Treasury Inflation-Protected Securities (TIPS) over the next five years has fallen from 3.1% to 2.6% over the past month and down from the peak of 3.7% earlier this year.
The University of Michigan survey of consumers’ long-term inflation expectations fell from 3.3% to 3.1%.
The latest data on supply chains from the New York Fed indicate supply bottlenecks are easing.
Also, consider the evidence that consumers are in pretty good shape overall heading into the latest inflation surge:
At 3.8%, the unemployment rate is reaching 50-year lows, while wages are up more than 5% over year-ago levels, according to the latest Bureau of Labor Statistics data. While that worries the Fed, it puts consumers in a better position to weather this storm. Also, consider there are over 11 million job openings in the U.S. compared with 6 million unemployed people.
U.S. households held $3.2 trillion more in checkable deposits on March 31, 2022 than at the end of 2019 before the pandemic. Money market assets are also nearly $1 trillion above December 2019 levels.
The financial obligations ratio was 14.2% as of March 31, 2022, below the pre-pandemic lows going back to 1980. Consumers’ discretionary incomes in aggregate are nicely covering debt obligations (mortgages, car loans, home equity loans, etc.).
Risks are clear
Just because consumers have some things going for them doesn’t mean the surge in inflation isn’t painful, nor does it necessarily mean the U.S. economy will avoid recession. LPL Research places 50% odds of a recession within the next 18 months, so we’re not discounting that probability. The Fed’s spotty track record of fighting inflation without causing a recession does little to instill confidence. The good news is that if the economy does contract to the point where it is officially labeled a recession (the National Bureau of Labor Statistics makes that call), the impact will likely be muted somewhat by the strong financial position enjoyed by consumers heading into it. Keep in mind that two straight negative GDP quarters is not sufficient to “qualify” for a recession. NBER’s broader definition will likely enable the economy to avoid recession in the first half regardless, though GDP may eke out a small gain anyway. Other risks to keep an eye on include another possible spike in energy prices, which could push interest rates higher and weigh on the economy and stock valuations. Geopolitical tensions could escalate in Europe at any time (though we could also get a surprise resolution/cease-fire). Finally, the longer that inflation remains stubbornly high, the more aggressive the Fed will get with rate hikes, increasing the odds of a recession. Some components of inflation such as housing and wages will be very hard to bring down, and inflation can become entrenched the longer it lingers and potentially gets embedded in consumer expectations.
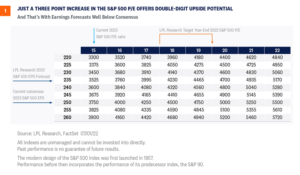
So what is this market worth?
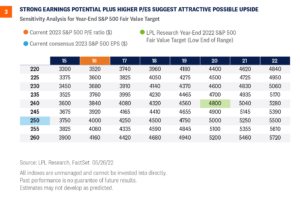
Valuing stocks during periods of high uncertainty is tricky. On the upside, we think stocks may be worth more than 20 times earnings in a return to an environment of low inflation and low and stable interest rates. We’ll probably get there eventually, but that’s very unlikely to occur this year. Interest rates have only come down because of recession fears, while inflation will still be elevated—even if somewhat lower—when the calendar turns to 2023 (unfortunately). So a P/E over 20 is probably too rich. Remember stock valuations are inversely correlated to inflation and interest rates. On the opposite end of the spectrum, we know stocks have traded down to an average of around 13 times earnings during the lows of the past three bear markets. But our belief is that this economic and profit environment is better than in the early 1990s, early 2000s, or 2008-2009 and therefore supports higher valuations. Add to that our expectation that inflation will soon begin a steady march lower and that late-cycle valuations in the 18-19 range have been commonplace in recent decades. As a result, we believe a price-to-earnings ratio of 18-19 on 2023 S&P 500 earnings estimates is reasonable. As shown in Figure 1, a return to that multiple translates into potential double-digit returns for stocks over the rest of the year assuming earnings come through as we anticipated. Don’t forget that what matters to consumers also matters to politicians. President Biden’s approval rating has continued to decline amid higher inflation numbers, with a near perfect inverse correlation to gas prices. That has implications for the midterm elections, where Republicans will look to capitalize on inflation and spin their energy policies as the solution. Currently, betting markets show about 3:1 odds that Republicans will be able to take control of both the House of Representatives and the Senate in November.
Energy policy remains a wild card
To be sure, the Biden administration, while focused squarely on its policy of transitioning the economy towards a non-fossil fuel environment, has been trying to alleviate the burden of rising gasoline and diesel prices by trying to introduce a federal gasoline tax holiday. The administration wants the federal tax holiday, which would take 18.4 cents off a gallon of gasoline, to be introduced along with a state tax holiday. A tax break from both state and federal governments is expected to give consumers approximately $30 of savings per month for one weekly fill-up. The breakdown in savings comes from the 18.4 cents per gallon for the federal tax and 31 cents per gallon on average from state governments. The tax holiday, which would last for three months, needs congressional approval, and so far, despite intense lobbying efforts, approval doesn’t appear forthcoming. In addition, the administration has become increasingly vocal in encouraging energy companies to increase drilling, while an upcoming presidential visit to Saudi Arabia is being highlighted as an opportunity to discuss measures to foster peace in the Middle East. Still, given that Saudi Arabia is the de facto leader of OPEC, the goals of the visit undoubtedly include an attempt to return with an agreement for higher oil production levels. OPEC, despite raising production levels in July and August, is seemingly intent on keeping prices high as member countries recover from the drought of demand incurred by the pandemic. Ironically, although lower gasoline prices could encourage more consumer discretionary spending, it could also lead to more travel by car, exactly the opposite of what’s needed to help bring down inflation. A long-term solution still remains unclear, as the low oil price environment that has reigned over much of the past eight years has consistently punished American oil companies for investment and rewarded more shareholder-friendly policies such as dividends and share buybacks. Still, the all-important U.S. consumer needs a break regardless of how it’s delivered.
Energy prices drive inflation expectations
Nothing we have addressed so far is especially positive, so let’s get to that part. While the gasoline prices shown in Figure 1 are just pennies removed from those all-time highs, gas prices at the pump tend to operate on a lag from real world commodity prices. In the past few weeks, the price of West Texas Intermediate (WTI) crude oil has fallen approximately 15%, losing a technical support level we believed would hold near $115/barrel. While the trend in most energy/oil prices is still higher from a long-term perspective, numerous other commodities that have experienced strong bullish runs appear to be more clearly breaking down, so the odds of a top in oil prices may be higher than just the chart itself suggests. As global central banks fight inflationary pressures around the globe with rate hikes, the result has been a perception that the economy will not be able to withstand continued tightening of financial conditions and will fall into a marked slowdown, if not an all-out recession. For instance copper, often referred to as Dr. Copper for its ability to forecast economic conditions, just hit its lowest level since February 2021. That in and of itself isn’t a positive, but as shown in Figure 2, market-based inflation expectations are highly correlated with commodities, especially oil, and those also appear to be rolling over recently, with the two-year breakeven implied inflation rate recently hitting its lowest level in four months.
Conclusion
The risk-reward for stocks looks favorable to us at current levels based on what we see as more potential upside than downside. The average non-recessionary bear market decline has been about 24%, roughly in line with the most recent peak-to-trough decline. But for the double-digit percent upside to be realized by year-end, inflation has to start coming down soon, helping boost the economy on the back of consumers. History appears be on the market’s side, as the S&P 500 could be poised for solid gains ahead: After the worst two-quarter performances in history, where the S&P 500 has dropped more than 20%, it has gained back over 21% on average in next half-year, and over 31% on average a full year out.
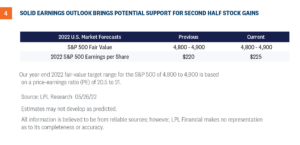
The average gain off of midterm election lows, which may have been set in June, has been over 30%.
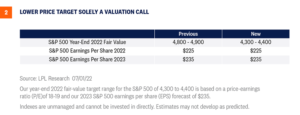
Despite our still constructive—not complacent—stance, stocks warrant lower valuations based on higher interest rates and troublesome inflation picture. Our revised year-end 2022 fair value S&P 500 target of 4,300-4,400 is still more than 12% above the July 1 closing price at the low end, but is 10% below our prior target. We still expect a growing economy and solid earnings gains in the second half to fuel higher stock prices, though gains will likely be back-end loaded given the time it will take for inflation to come down enough for the Fed to signal a pause. We continue to recommend an overweight allocation to equities and underweight to fixed income relative to investors’ targets, as appropriate. For more risk-tolerant investors or investors with neutral positioning, we would consider increasing equity allocations slightly, as the LPL Research Strategic and Tactical Asset Allocation Committee (STAAC) has done in July as more evidence that the market’s bottoming process is progressing has emerged. Jeffrey Buchbinder, CFA, Equity Strategist, LPL Financial Jeffrey Roach, PhD, Chief Economist, LPL Financial George Smith, CFA, CAIA, CIPM, Portfolio Strategist, LPL Financial ______________________________________________________________________________________________ IMPORTANT DISCLOSURES This material is for general information only and is not intended to provide specific advice or recommendations for any individual. There is no assurance that the views or strategies discussed are suitable for all investors or will yield positive outcomes. Investing involves risks including possible loss of principal. Any economic forecasts set forth may not develop as predicted and are subject to change. References to markets, asset classes, and sectors are generally regarding the corresponding market index. Indexes are unmanaged statistical composites and cannot be invested into directly. Index performance is not indicative of the performance of any investment and does not reflect fees, expenses, or sales charges. All performance referenced is historical and is no guarantee of future results. Any company names noted herein are for educational purposes only and not an indication of trading intent or a solicitation of their products or services. LPL Financial doesn’t provide research on individual equities. All information is believed to be from reliable sources; however, LPL Financial makes no representation as to its completeness or accuracy. U.S. Treasuries may be considered “safe haven” investments but do carry some degree of risk including interest rate, credit, and market risk. Bonds are subject to market and interest rate risk if sold prior to maturity. Bond values will decline as interest rates rise and bonds are subject to availability and change in price. The Standard & Poor’s 500 Index (S&P500) is a capitalization-weighted index of 500 stocks designed to measure performance of the broad domestic economy through changes in the aggregate market value of 500 stocks representing all major industries. The PE ratio (price-to-earnings ratio) is a measure of the price paid for a share relative to the annual net income or profit earned by the firm per share. It is a financial ratio used for valuation: a higher PE ratio means that investors are paying more for each unit of net income, so the stock is more expensive compared to one with lower PE ratio. Earnings per share (EPS) is the portion of a company’s profit allocated to each outstanding share of common stock. EPS serves as an indicator of a company’s profitability. Earnings per share is generally considered to be the single most important variable in determining a share’s price. It is also a major component used to calculate the price-to-earnings valuation ratio. All index data from FactSet. This research material has been prepared by LPL Financial LLC. Securities and advisory services offered through LPL Financial (LPL), a registered inv estment advisor and broker -dealer (member FINRA/SIPC). Insurance products are offered through LPL or its licensed affiliates. To the extent you are receiving investment a dvice from a separately registered independent investment advisor that is not an LPL affiliate, please note LPL makes no representation with respect to such entity. Not Insured by FDIC/NCUA or Any Other Government Agency | Not Bank/Credit Union Guaranteed | Not Bank/Credit Union Deposits or Obligations | May Lose Value
RES-1206450-0622 | For Public Use | Tracking # 1-05300438 (Exp. 07/23)
This year has been tough for investors, not just because stocks have fallen but also because bonds have not helped mitigate those losses as they have historically done. Below we discuss the outlook for diversified portfolios of stocks and bonds to make the case that the 60/40 portfolio isn’t dead. It may have been wounded this year, and took another blow on Friday after the hotter-than-expected inflation data, but we believe the losses in stocks and bonds this year increase the chances of positive outcomes going forward. Long-term investors take note.
Tough year for the traditional 60/40 portfolio
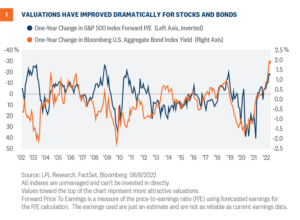
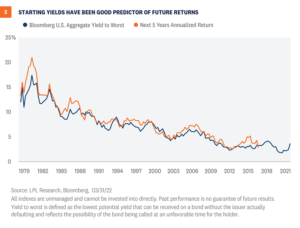
It’s been a tough year so far for a traditional “60/40” portfolio, a portfolio of 60% stocks and 40% bonds. Using the S&P 500 Index and the Bloomberg U.S. Aggregate Bond Index (“Agg”) to represent stocks and bonds, the traditional 60/40 was down 15% as of market close on June 10 on a total return basis. If the year ended now, that loss would trail only 2008 as the worst year on record (the Agg’s first year was 1976). Bonds have typically seen gains during historical periods of equity volatility, although not always. But low bond yields in 2020 and 2021 and steep bond losses due to rising rates in 2022 have led many to speculate that the 60/40 portfolio is dead. But there’s something of a silver lining in the declines. Recent stock and bond losses have improved valuations for the 60/40 portfolio considerably, based on a combination of the price-to-earnings ratio for the S&P 500 and the yield for the Agg. Valuations aren’t an effective market timing mechanism, but they are an important consideration for longer-term return expectations, and that picture has improved quite a bit. The time to talk about the death of the 60/40 portfolio was six months to a year ago, and even then it was probably exaggerated. The 60/40 portfolio may not get back to the level of returns we’ve seen over the last several decades, but over the last year the 10-year outlook for the 60/40 has improved by about 2 percentage points annualized in our view, about as big a one-year improvement as we’ve seen at any time in the last 20 years, as shown in Figure 1.
Five points of perspective
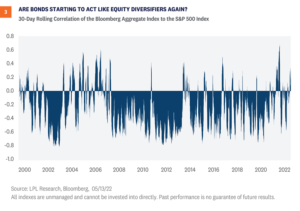
For the many investors whose experience this year has them questioning the value of the traditional 60/40 portfolio, here are five things that provide perspective. 1) What we’ve seen in 2022 so far is unusual Since the inception of the Agg in 1976, the S&P 500 has been down over a calendar year eight times. The Agg was higher every single time (although only by 0.01% in 2018). Those were also the worst eight years for 60/40 performance. From the bond perspective, the Agg has been negative four times in its history, the worst year being a 2.9% decline in 1994. It’s a small sample, and isn’t holding so far this year, but the S&P 500 was higher every time with an average gain over 20%. 2) The picture is a little more complicated when looking at quarterly data Since 1976, the S&P 500 has had 50 negative quarters. The Agg has been lower in 16 of them. The worst quarter for the 60/40 was the fourth quarter of 2008, driven by stock losses. The Agg was actually higher that quarter. The worst quarter for the 60/40 in which the Agg was negative was the third quarter of 1981, with the 60/40 down 7.8%. As of June 8, the current quarter would be but the twelfth worst for the 60/40 overall, mostly due to prior quarters that saw heavy stock declines, and the second worst for the 60/40 when the Agg had a negative quarter, trailing only the third quarter of 1981. 3) Bonds can go down too, even when stocks do Using quarterly data, the historical correlation between the S&P 500 and the Agg is close to zero. Stocks and bonds tend to each go their own way relative to average performance rather than moving in decidedly opposite directions. It’s also important to remember that bonds, just like stocks, sometimes decline. The S&P 500 has been lower 27% of all quarters over the lifetime of the Agg; By comparison, the Agg has been lower 23% of all quarters, a relatively small difference. When the S&P 500 is down in a quarter, the Agg is down 32% of the time. 4) Stock valuations have improved dramatically The forward price-to-earnings ratio (P/E) for the S&P 500 as of the end of May 2021 was 21.2 according to FactSet data. On June 8, helped by higher earnings and not just lower stock prices, it was down to 17.4. As seen in Figure 1, that’s an improvement of 18%, while Friday’s losses bring that number closer to 20%. (P/Es improve as they fall, since stocks are “cheaper” relative to earnings.) That decline translates into almost a 2 percentage point improvement in the annual return expectation of the S&P 500 over the next 10 years, although many factors can strongly influence the actual outcome. Outside of earlier this year, that’s the fastest one-year improvement in the forward P/E since 2009. Even with the dramatic decline in P/E, S&P 500 valuations are still slightly above their historical average, but the improvement is meaningful. Bond valuations have improved dramatically too. The yield on the Agg as of the end of May 2021 was 1.50%. On June 8 it was 3.53%. This is the fastest one-year improvement in yields since 1995. That likewise represents an improved annual expected return of roughly 2 percentage points over the next 10 years. There are factors that can make the actual outcome differ from the expectation here as well, but the difference is less variable than for stocks simply because you know the price you’ll get for a bond at maturity. 5) Dislocations create opportunities for strategic investors We’ve been focusing here on the S&P 500 Index, perhaps the most well-known and widely used stock index in the world. But it’s not the only area of the market where stock valuations have improved, and some may offer even better value. Despite its improvement, the S&P 500’s P/E is still in the 82nd percentile of all values going back 20 years, according to FactSet data, with higher percentiles representing less attractive valuation. But there are areas of the market that are in the 10th percentile or lower of all values over the same timeframe and sitting near levels only seen during the Great Financial Crisis and in March of 2020. Prospects for long-term returns for small caps have improved, for example, as valuations have dipped well below long-term averages. Similarly, there are pockets of the bond market seeing unusually high yield levels relative to the past decade. For both stocks and bonds, attractive valuations tend to be accompanied by very challenging economic conditions, but the most opportune moments often are. Where we see the best strategic opportunities is a piece for another day, but pockets of even more attractive, even extreme, valuations do suggest that for long-term investors there may be ways to further diversify a traditional 60/40.
Conclusion
Recent changes in valuations have improved the outlook for a traditional 60/40 portfolio considerably, in our view, on both the stock side and the bond side. We do think of the traditional 60/40 portfolio only as a starting point for an appropriate investor. And even if the traditional 60/40 portfolio is very much alive, as we believe, there may still be opportunities to improve the risk profile of a portfolio, whether through greater diversification within stock or bond holdings, active management, or investment opportunities outside of traditional stocks and bonds. It’s been a tough year for many investors, and we don’t think we’re in a position yet to call a tactical bottom for either stocks or bonds despite last week’s losses. But looking out strategically, based on better valuations and still mostly favorable fundamentals, we think the long-term outlook has brightened quite a bit. Barry Gilbert, PhD, CFA, Asset Allocation Strategist, LPL Financial Jeffrey Buchbinder, CFA, Equity Strategist, LPL Financial ______________________________________________________________________________________________ IMPORTANT DISCLOSURES This material is for general information only and is not intended to provide specific advice or recommendations for any individual. There is no assurance that the views or strategies discussed are suitable for all investors or will yield positive outcomes. Investing involves risks including possible loss of principal. Any economic forecasts set forth may not develop as predicted and are subject to change. References to markets, asset classes, and sectors are generally regarding the corresponding market index. Indexes are unmanaged statistical composites and cannot be invested into directly. Index performance is not indicative of the performance of any investment and does not reflect fees, expenses, or sales charges. All performance referenced is historical and is no guarantee of future results. Any company names noted herein are for educational purposes only and not an indication of trading intent or a solicitation of their products or services. LPL Financial doesn’t provide research on individual equities. All information is believed to be from reliable sources; however, LPL Financial makes no representation as to its completeness or accuracy. U.S. Treasuries may be considered “safe haven” investments but do carry some degree of risk including interest rate, credit, and market risk. Bonds are subject to market and interest rate risk if sold prior to maturity. Bond values will decline as interest rates rise and bonds are subject to availability and change in price. The Standard & Poor’s 500 Index (S&P500) is a capitalization-weighted index of 500 stocks designed to measure performance of the broad domestic economy through changes in the aggregate market value of 500 stocks representing all major industries. The Bloomberg Aggregate U.S. Bond Index represents securities that are SEC-registered, taxable, and dollar denominated. The index covers the U.S. investment-grade fixed rate bond market, with index components for government and corporate securities, mortgage pass-through securities, and asset-backed securities. The PE ratio (price-to-earnings ratio) is a measure of the price paid for a share relative to the annual net income or profit earned by the firm per share. It is a financial ratio used for valuation: a higher PE ratio means that investors are paying more for each unit of net income, so the stock is more expensive compared to one with lower PE ratio. Forward Price to Earnings is a measure of the price-to-earnings ratio (P/E) using forecasted earnings for the P/E calculation. While the earnings used are just an estimate and are not as reliable as current earnings data, there is still benefit in estimated P/E analysis. The forecasted earnings used in the formula can either be for the next 12 months or for the next full-year fiscal period. Earnings per share (EPS) is the portion of a company’s profit allocated to each outstanding share of common stock. EPS serves as an indicator of a company’s profitability. Earnings per share is generally considered to be the single most important variable in determining a share’s price. It is also a major component used to calculate the price-to-earnings valuation ratio. All index data from FactSet. This research material has been prepared by LPL Financial LLC. Securities and advisory services offered through LPL Financial (LPL), a registered inv estment advisor and broker -dealer (member FINRA/SIPC). Insurance products are offered through LPL or its licensed affiliates. To the extent you are receiving investment a dvice from a separately registered independent investment advisor that is not an LPL affiliate, please note LPL makes no representation with respect to such entity. Not Insured by FDIC/NCUA or Any Other Government Agency | Not Bank/Credit Union Guaranteed | Not Bank/Credit Union Deposits or Obligations | May Lose Value
RES-1184900-0622 | For Public Use | Tracking # 1-05292377 (Exp. 06/23)
Core bond investors have experienced the worst start to the year ever. However tough this year has been so far though (and it has been tough), the potential for future returns has improved meaningfully, in our view. Starting yields tend to be a good predictor of future returns and have become more attractive in a number of markets recently. With yields on most fixed income markets moving sharply higher, now could be a good time to revisit fixed income markets.
Reasons to Own Core Bonds?
For us, the value proposition for core bonds (as defined by the bonds within the Bloomberg Aggregate Bond index) is that they tend to provide potential for liquidity, diversification (to potentially counter equity market risk), and positive total returns to portfolios. Unfortunately, none of those values are 100% certain all the time. Like all markets, fixed income investing involves risks and at times, negative returns. However, despite the historically poor start to the year, the value proposition for core bonds has actually improved recently. Investing is a forward-looking exercise, and with the back up in yields already taking place this year, we believe now could be as good as it’s been in quite some time for core bonds. Importantly, yields are moving higher because of the expectations of higher short-term interest rates and not an increase in credit risk. Coming into the year, markets were only expecting one or two short-term interest rate hikes by the Federal Reserve (Fed) this year with most of the hikes expected to come in 2023. However, markets have aggressively re-priced the number of expected Fed rate hikes and now expect as many as 11. As such, the yield on the 10-year Treasury security has doubled this year after increasing around 100 basis points (1.00%) off its lows in 2020. The 260 basis point (2.6%) move higher that has already taken place this cycle is the biggest move higher in yields since 1994, when rates moved higher by 280 basis points—and that was at the end of the rate hiking cycle. With so many rate hikes priced in at this point, we think the worst is behind us. So have rates peaked? Historically, rates have tended to move a lot before the first rate hike, (like they’ve already done this year) but they still move marginally higher throughout the rate hiking process and don’t actually make a top until the Fed stops raising rates. This cycle has only really just started. That doesn’t mean we will see significantly higher yields—we don’t think we will—but we could see 3.25-3.35% on the 10-year this year, which would likely be the top in yields for this cycle, in our view. However, we still expect yields to trade in a range between 2.75-3.0% for most of the year and then fall slightly from current levels throughout the year with the 10-year Treasury yield ending the year around 2.5%. So, as mentioned, we have seen a big move higher in rates this year but we do think the worst is behind us.
No More Tina?
TINA, or “there is no alternative,” has been a big reason diversified asset allocation portfolios have been overly geared towards equities over the past few years. The relative attractiveness of equities over fixed income was undeniable when interest rates were hovering around all-time lows. Now interest rates have moved higher recently, though the relative attractiveness between the two broad asset classes is much more balanced (albeit still leaning favorable towards equities by at least one measure as we explain in this blog found here). But, for investors unwilling or uninterested in taking on additional equity risks, there are a number of fixed income markets with yields trading above long-term averages. As seen in Figure 1, the yield-to-worst on most fixed income asset classes is hovering around the highest yields we’ve seen in a decade. And for the Bloomberg Aggregate index, which is the broad based core bond index, outside of two months in 2018, yields are the highest they’ve been since 2010. Since starting yield levels have been a good predictor of future returns (see below), with yields increasing meaningfully this year, future returns look more attractive than they have in years. With interest rates so low over the past few years, the back-up in yields could be an attractive opportunity for suitable income-oriented investors. And while we can’t guarantee that interest rates won’t go higher, at current yields, the risk/reward for owning fixed income has improved, in our opinion. As mentioned, for many fixed income asset classes, starting yield levels have been an accurate predictor of future returns. Bonds, for the most part, are unique in their structures in that, absent defaults, expected returns are largely determined by starting yields. That is, we tend to have a pretty good idea what to expect out of many fixed income instruments over time because coupon and principal payments are known in advance and contractually obligated. As such, whether you’re invested in an individual bond, an investment that tracks an index like the Bloomberg Aggregate index, [Figure 2] or a strategy designed to actively outperform an index, returns are largely predicated on starting yields. And this is true if you hold the fixed income instrument to maturity (for an individual bond) or at least five years (for a portfolio of bonds) regardless of what interest rates do in the interim. That is, if you buy and hold a fixed income investment, the short-term volatility you experience due to changing interest rate expectations is just volatility. It has very little bearing on the actual total return if held to maturity (or if held to the average maturity of a portfolio of bonds).
Diversification Benefits of Bonds May Be Improving
Since 2000, the correlation between stocks and bonds has generally been negative, although there has been considerable variation with that relationship. And at times, the relationship between stocks and bonds has, in fact, been positive (from 1965 to 2000, correlation was actually slightly positive due to higher inflation and more frequent inflationary shocks). So, the historical correlation between stocks and bonds is actually close to zero—meaning it’s generally noisy. In other words, it isn’t that uncommon to see equity and bond prices moving lower (or higher) at the same time. However, now that interest rates have moved off the all-time lows set back in August 2020, there is more of a cushion to act like a diversifier during equity market drawdowns, which is what we’ve seen during the most recent equity market stresses over the past few weeks. Since the start of May, equities are down over 6% whereas core bonds are positive. And without any additional macroeconomic shocks driving the divergent returns, it’s comforting to see bonds providing that equity buffer, albeit over a very short time horizon. The back-up in yields this year has certainly been painful, but the ability for fixed income to act as an equity buffer has increased, in our view. As bond and equity markets both move past the aggressive repricing of Fed rate hikes that have caused both markets to sell off this year and grapple with a potential slowdown in economic growth, bonds have the potential to mitigate the risk in portfolios again as we move through the year.
Conclusion
Core bonds have been a staple in diversified asset allocations. However, with returns as negative as they’ve been this year, investors may be undergoing a rethink of the utility of core bonds. We think that may be a mistake. We still think the value proposition for core bonds remains. Liquidity, equity diversification, and total returns are all valuable properties core bonds bring to diversified portfolios—and each of those value propositions have improved recently. Moreover, bonds are unique in their structures in that coupon and principal payments are, for the most part, guaranteed (unless the issuer defaults) and the primary factors of long-term total returns. The price volatility we’ve seen so far this year doesn’t impact those payments. And with yields higher in many markets, now may be a good time for suitable investors to start looking at additional investment opportunities within fixed income. Lawrence Gillum, CFA, Fixed Income Strategist, LPL Financial
Ryan Detrick, CMT, Chief Market Strategist, LPL Financial ______________________________________________________________________________________________ IMPORTANT DISCLOSURES This material is for general information only and is not intended to provide specific advice or recommendations for any individual. There is no assurance that the views or strategies discussed are suitable for all investors or will yield positive outcomes. Investing involves risks including possible loss of principal. Any economic forecasts set forth may not develop as predicted and are subject to change. References to markets, asset classes, and sectors are generally regarding the corresponding market index. Indexes are unmanaged statistical composites and cannot be invested into directly. Index performance is not indicative of the performance of any investment and do not reflect fees, expenses, or sales charges. All performance referenced is historical and is no guarantee of future results. Bonds are subject to market and interest rate risk if sold prior to maturity. Bond values will decline as interest rates rise and bonds are subject to availability and change in price. There is no guarantee that a diversified portfolio will enhance overall returns or outperform a non-diversified portfolio. Diversification does not protect against market risk. Any company names noted herein are for educational purposes only and not an indication of trading intent or a solicitation of their products or services. LPL Financial doesn’t provide research on individual equities. All information is believed to be from reliable sources; however, LPL Financial makes no representation as to its completeness or accuracy. US Treasuries may be considered “safe haven” investments but do carry some degree of risk including interest rate, credit, and market risk. Bonds are subject to market and interest rate risk if sold prior to maturity. Bond values will decline as interest rates rise and bonds are subject to availability and change in price. The Bloomberg Aggregate U.S. Bond Index represents securities that are SEC-registered, taxable, and dollar denominated. The index covers the U.S. investment-grade fixed rate bond market, with index components for government and corporate securities, mortgage pass-through securities, and asset-backed securities. The Standard & Poor’s 500 Index (S&P500) is a capitalization-weighted index of 500 stocks designed to measure performance of the broad domestic economy through changes in the aggregate market value of 500 stocks representing all major industries. All index data from FactSet. This research material has been prepared by LPL Financial LLC. Securities and advisory services offered through LPL Financial (LPL), a registered investment advisor and broker-dealer (member FINRA/SIPC). Insurance products are offered through LPL or its licensed affiliates. To the extent you are receiving investment advice from a separately registered independent investment advisor that is not an LPL affiliate, please note LPL makes no representation with respect to such entity. Not Insured by FDIC/NCUA or Any Other Government Agency | Not Bank/Credit Union Guaranteed | Not Bank/Credit Union Deposits or Obligations | May Lose Value
RES-1164201-0522 | For Public Use | Tracking # 1-05284424 (Exp. 5/23)